I discovered, developed and tested in experiment a new approach to measuring paraglider glide ratio.
Here is the polar curve of my wing:

A year ago a question was asked on Russian paragliding forum: «Why paraglider manufactures do not publish specifications on glide ratio of their wings?». I answered the question, that there is no reliable technique to measure glide ratio. But then I forwarded the question to myself.
Thinking has led me to an idea. For the sake of simplicity consider strait steady flight in calm air. Paraglider flies forward and a bit down relative to the air. Its velocity vector is directed forward-down, whether air itself moves relative to ground or not. What if we could place a special device near to the pilot? The device will orient itself along air flow. Then one can measure an angle between velocity vector and horizon. Angle is converted to glide ratio with simple formula: glide ratio = -ctg(angle).
Notice that airspeed is not present in the formula. Limited accuracy of airspeed measurement does not affect the result at all.
The main question is how to measure the angle. In other words, the task is to determine a plane of horizon provided that accelerations and rotations exist along all 3 axes. Years ago, the problem could be solved only with the aid of pricy and bulky equipment. Due to technical progress the problem can be solved with a small 5×5 mm chip now. It combines accelerometers, gyroscopes and magnetic sensors for all 3 axes.
Now for the design. If the device is made axisymmetric with a strong separation of the center of mass and the point of application of the aerodynamic force along this axis, then it will orientate itself along the air flow. Important note: the device should be suspended strictly in the center of mass. So, suspension will not affect its angular position.
Then the device should be placed 1) where it will rotate freely in pitch and heading 2) where air flow will not be disturbed by the wing or the pilot. 1 meter below the pilot is perfect position.
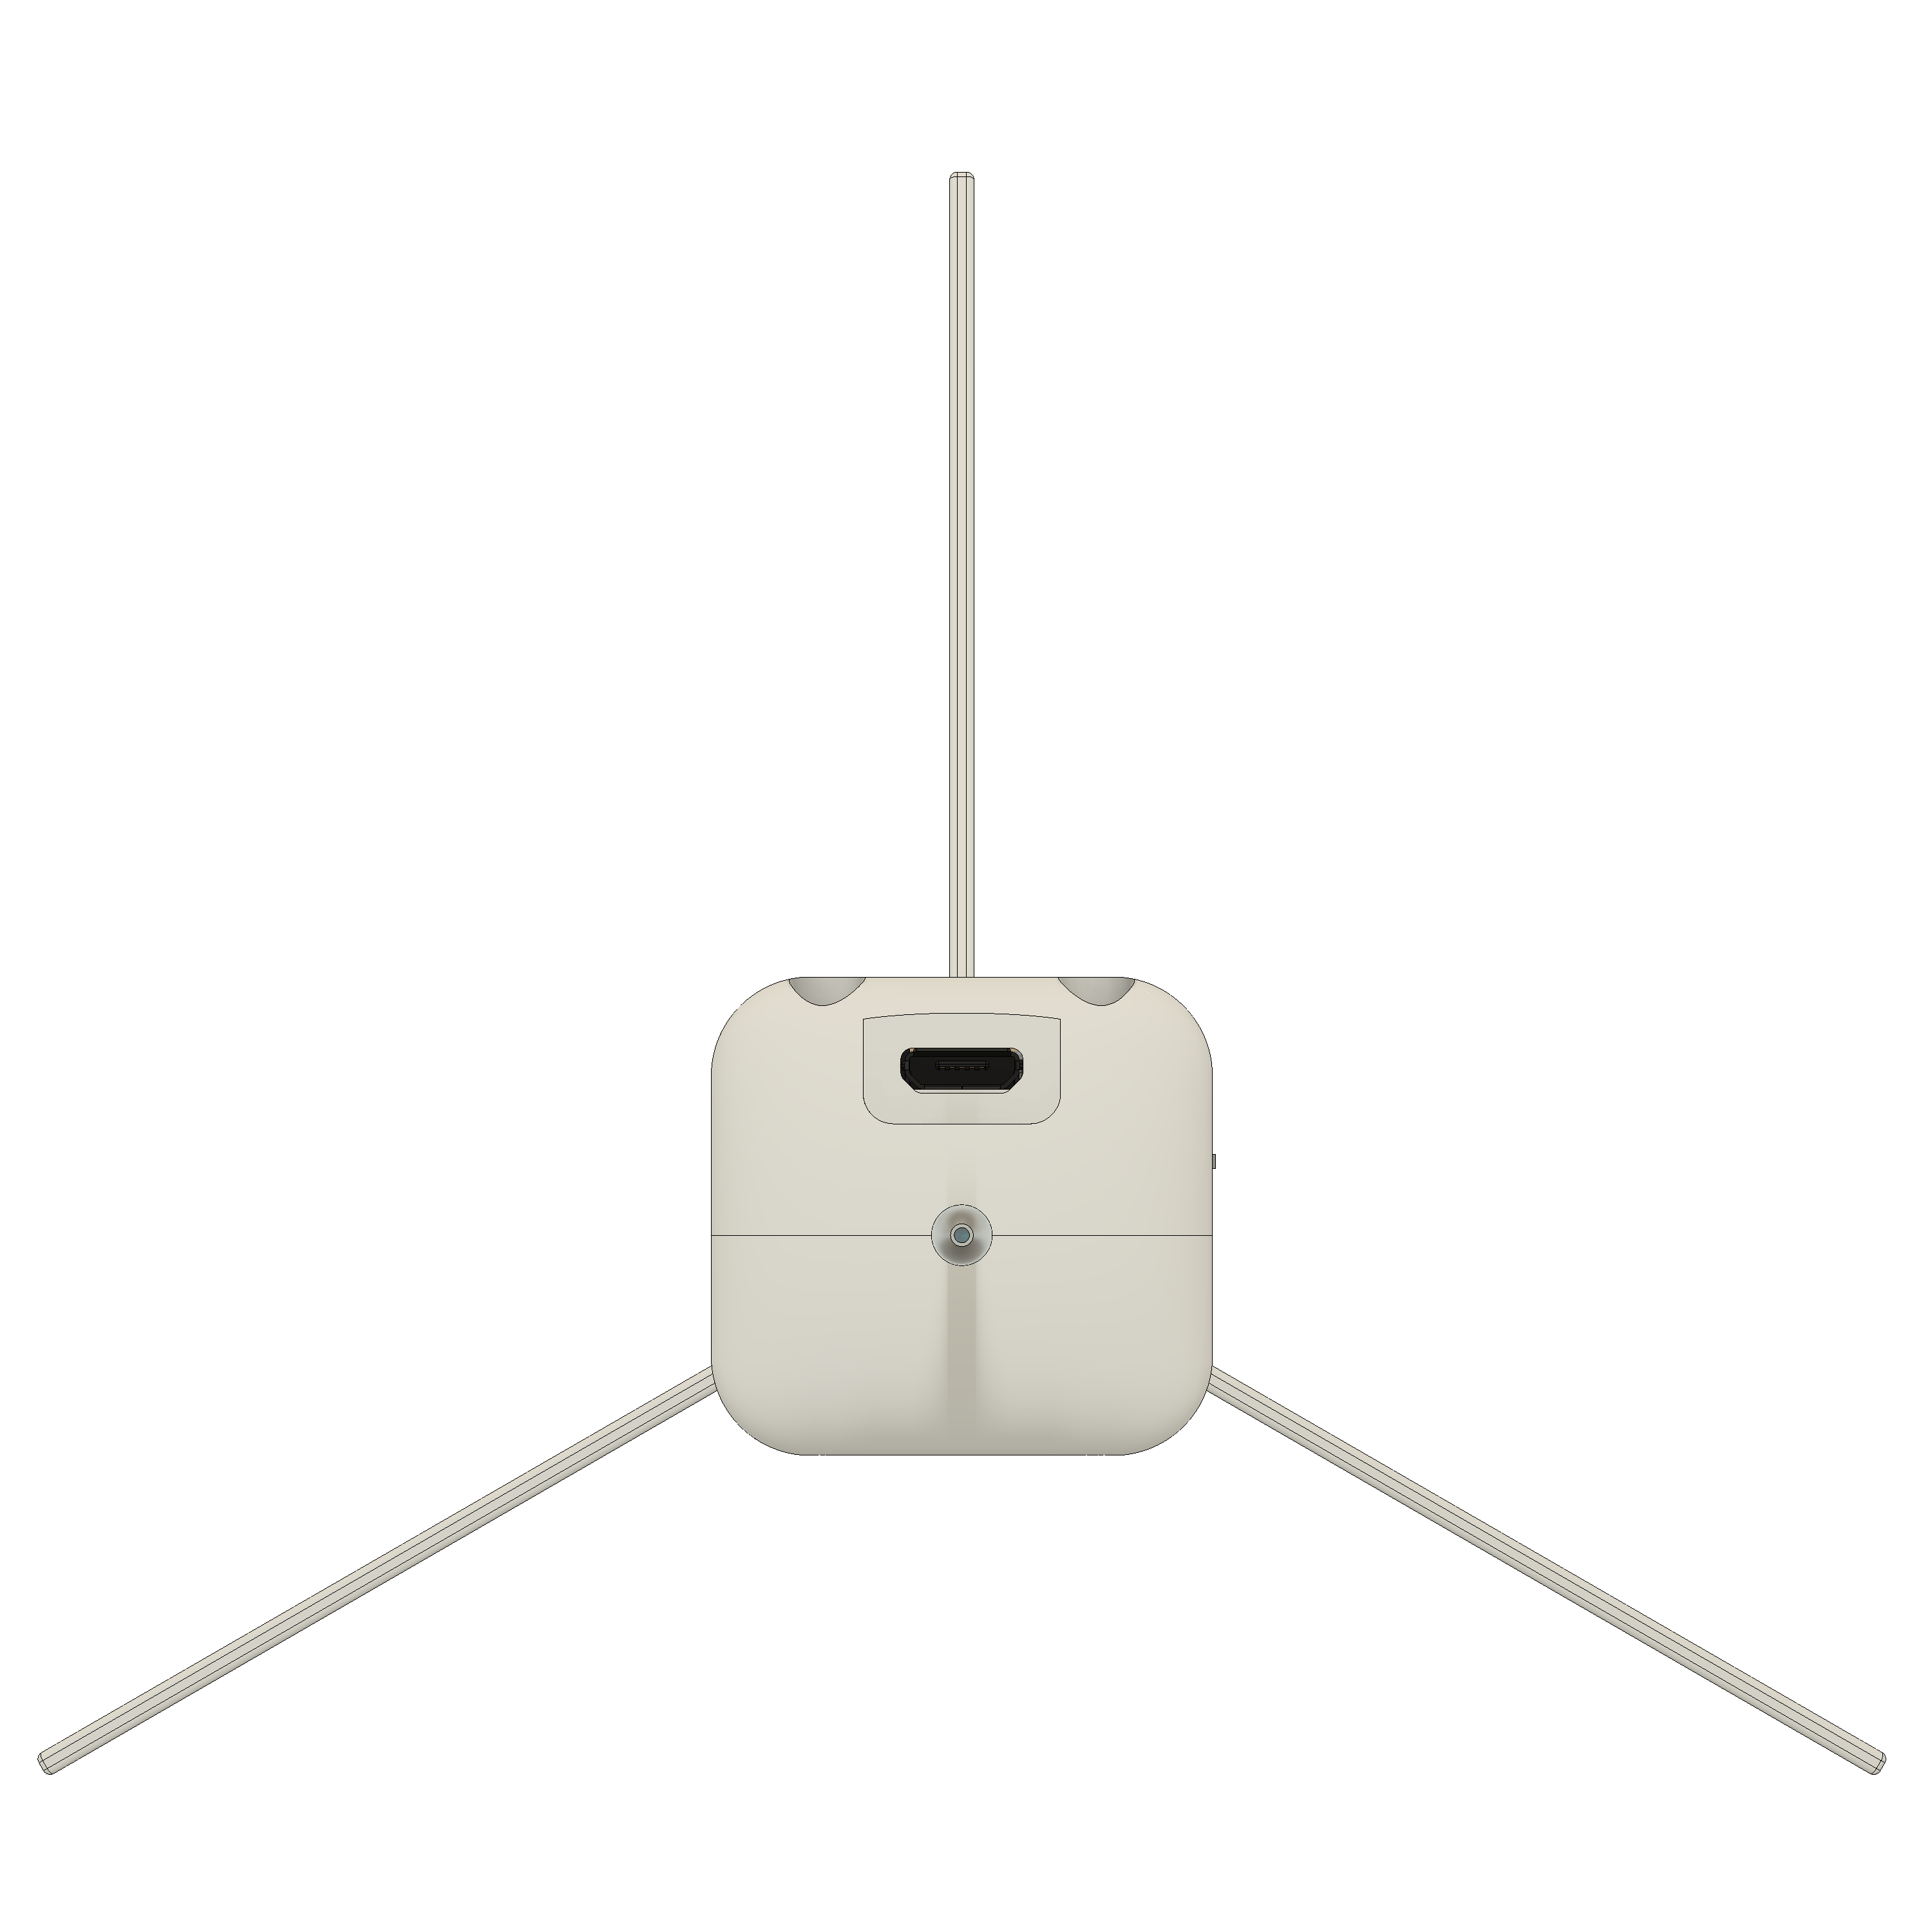
There is a big gap between inventing a device and having it designed and finally built. Keeping the idea of invention in my head, I opened Fusion 360 and started the design process. After returning to the very beginning and starting from scratch for the 3rd time I have got something like this:

Apart from orientation you need an airspeed to draw a polar curve. There is Pitot tube in front of the body. It is connected to differential pressure sensor then. There are sensors of absolute pressure, temperature and humidity inside as well.
In parallel I started to working on circuit design. The first prototype was based on development board Adafruit Bluefruit nRF52832. Sensors were attached with wires to it.
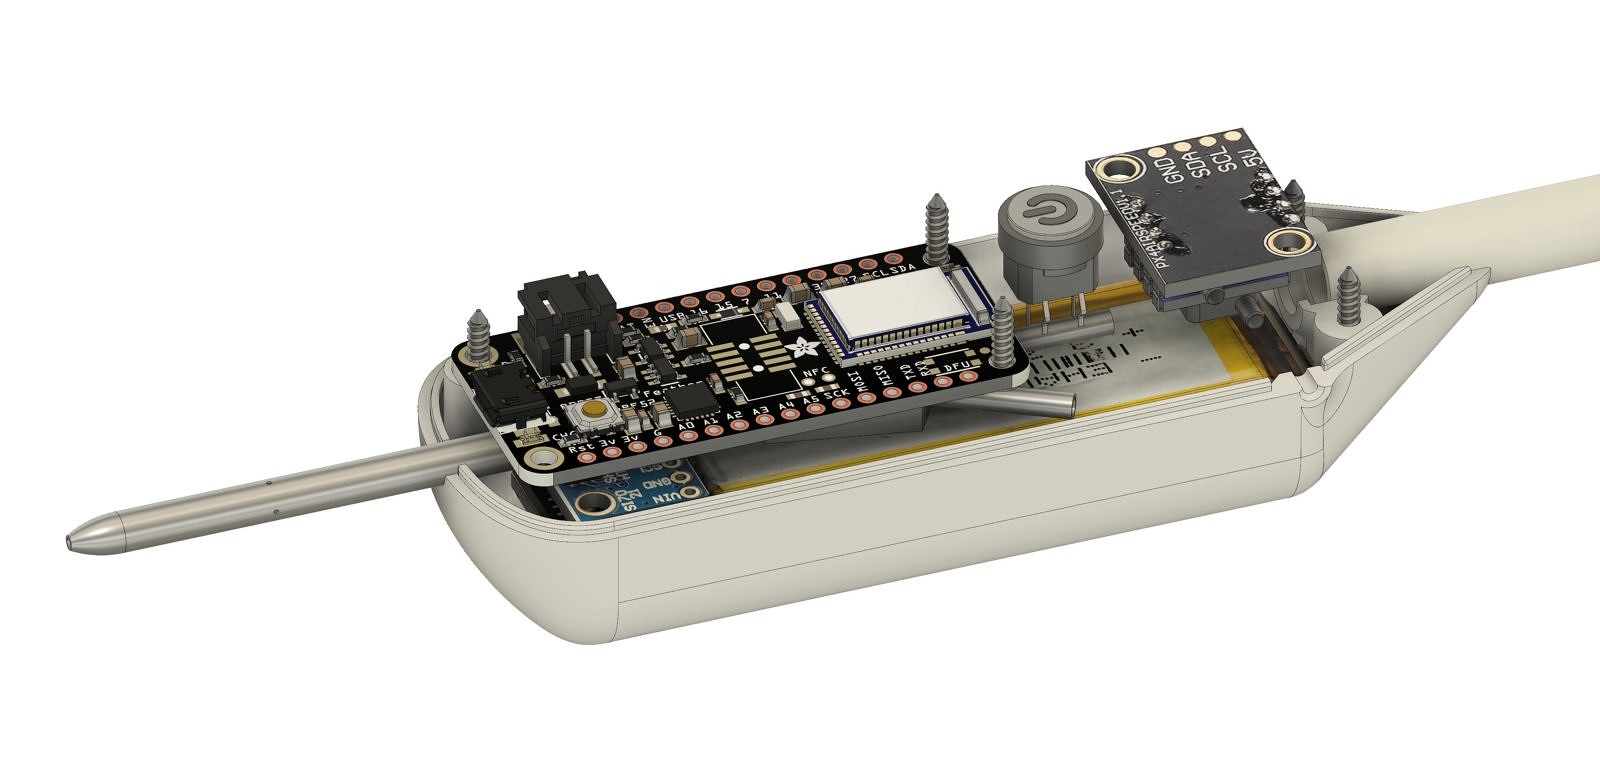
I understood soon that wires tend to break even in my hands, not to mention real flight. Next prototypes included factory made PCBs. Along the way I had to master in Eagle for PCB layout.
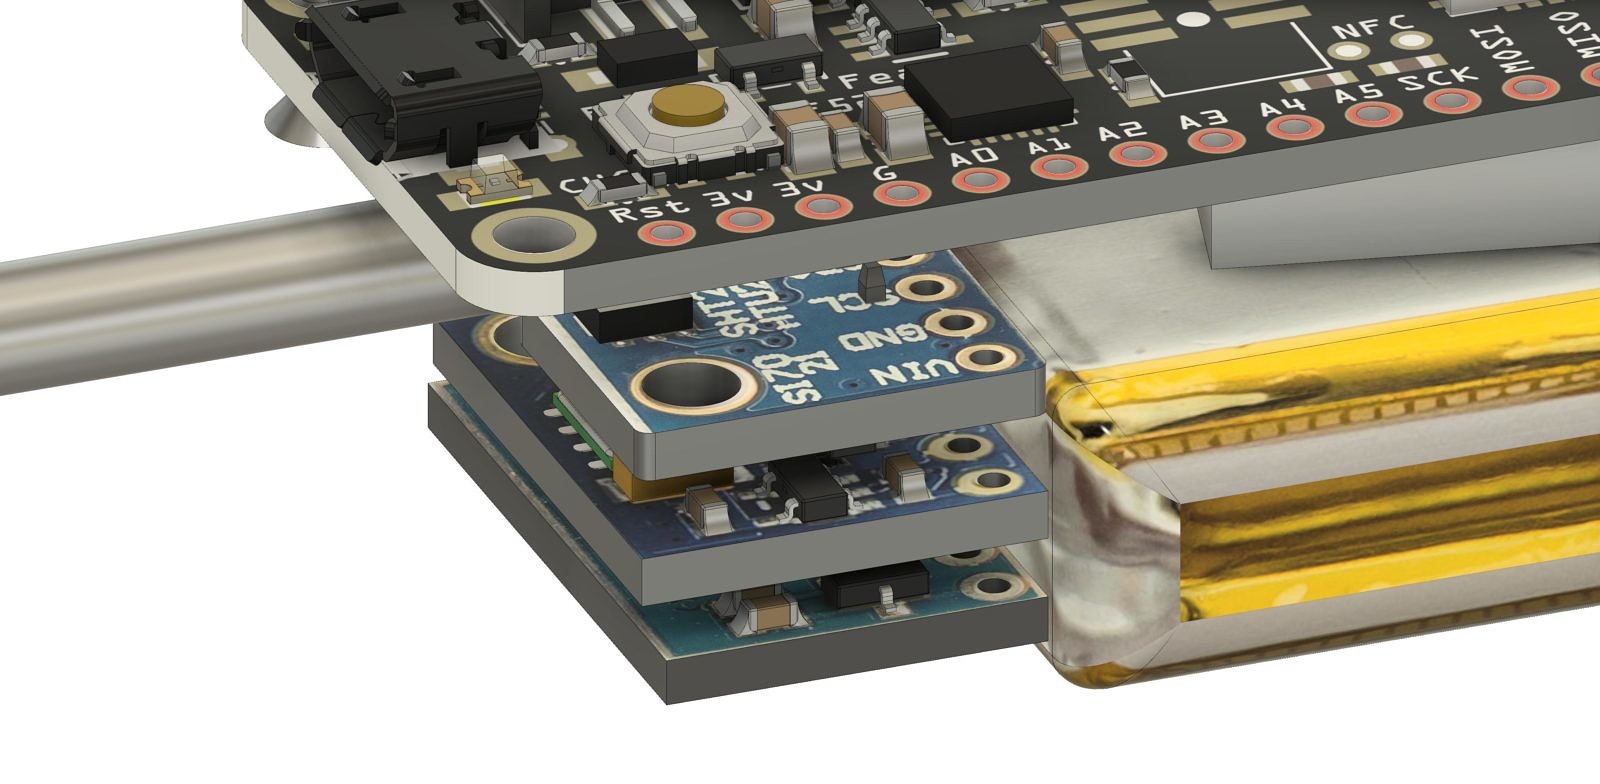
The prototypes included a mechanism for easy sensors replacement. I wanted to understand how different sensors perform, what precision and noise they have. Along the way GPS and MicroSD card slot were added to basic sensors, and MCU was replaced with ESP32.
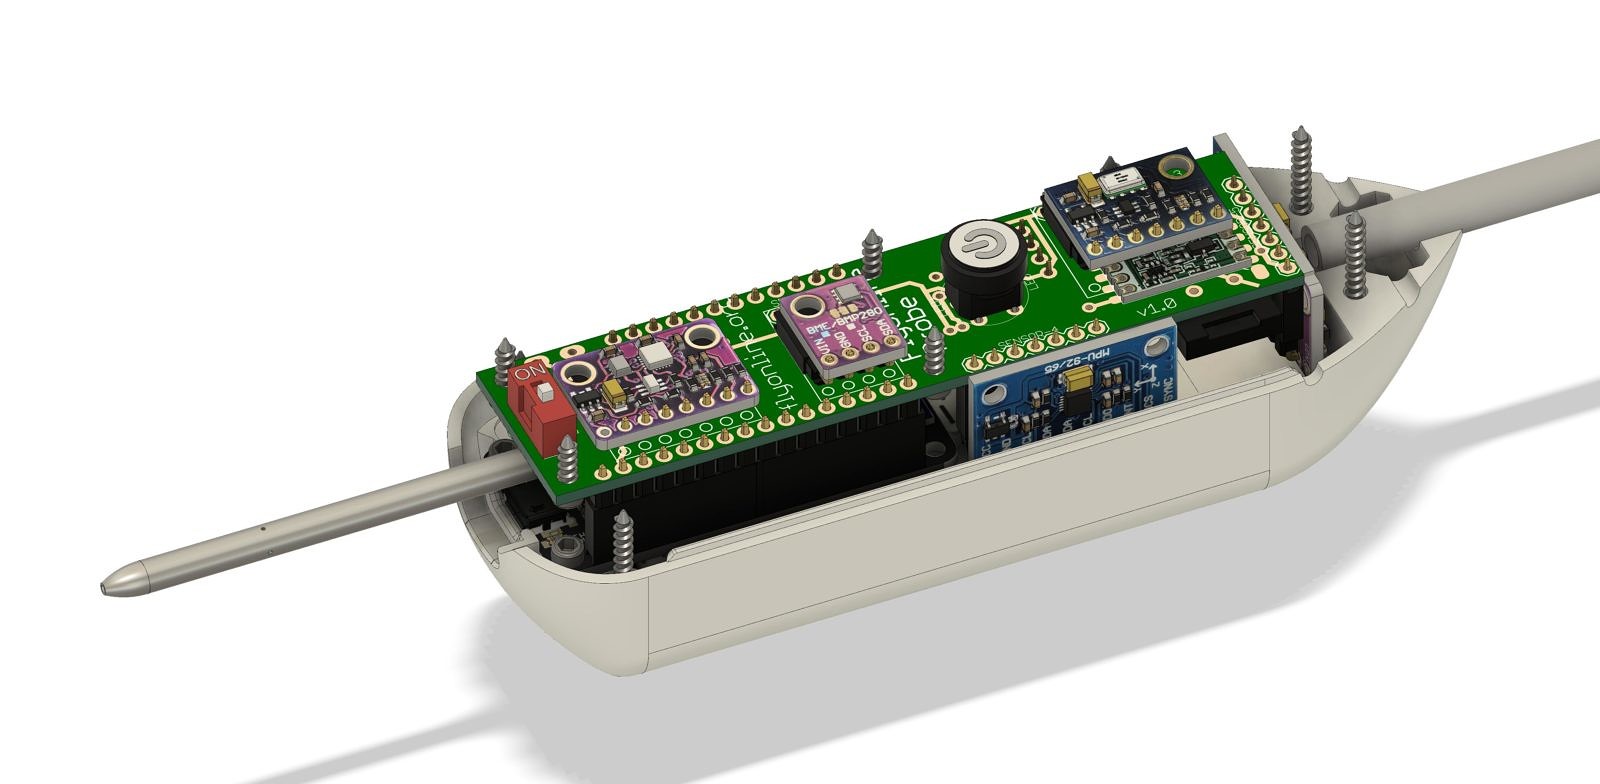
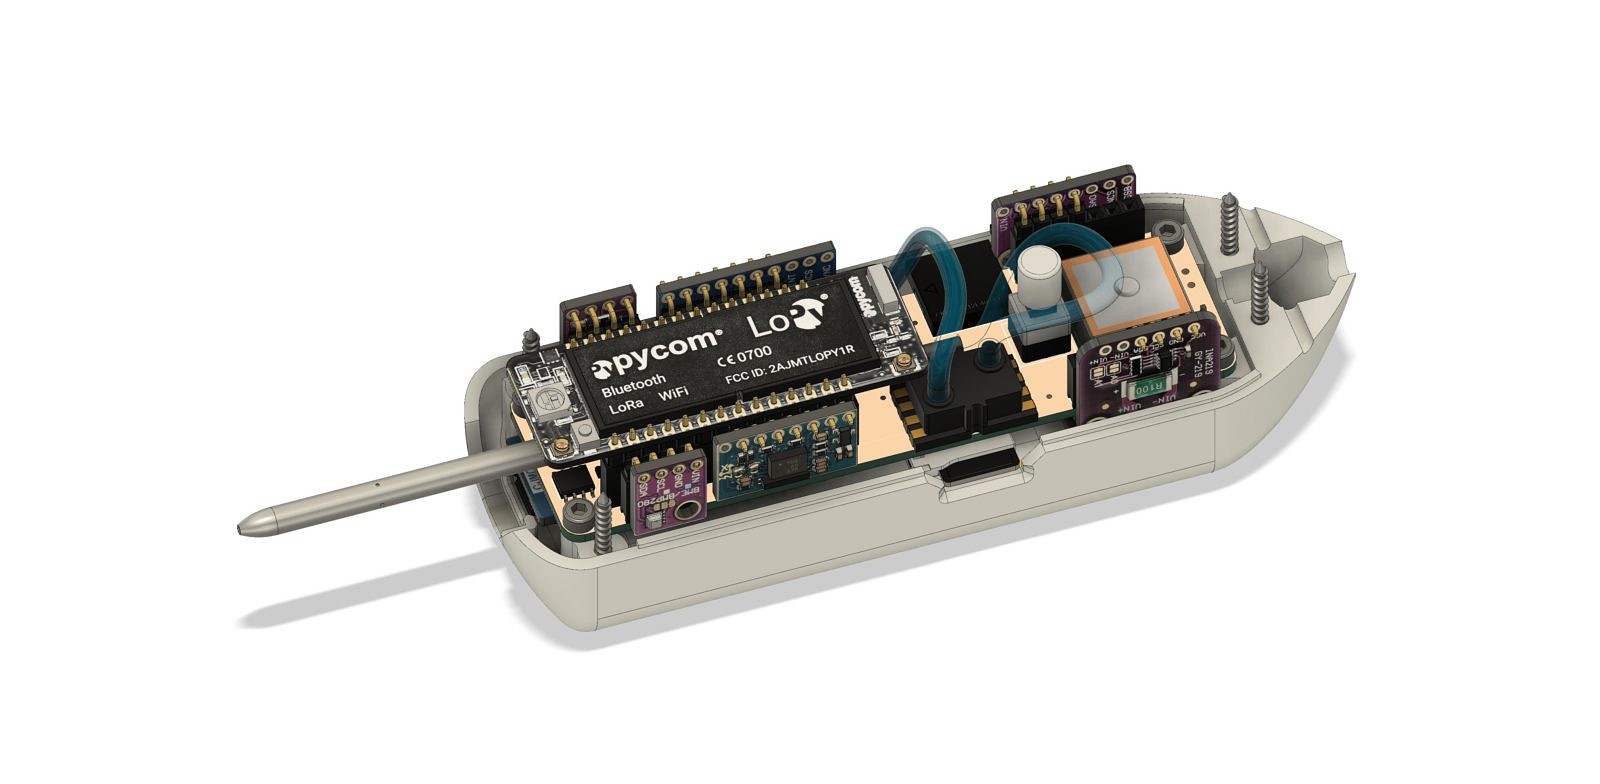
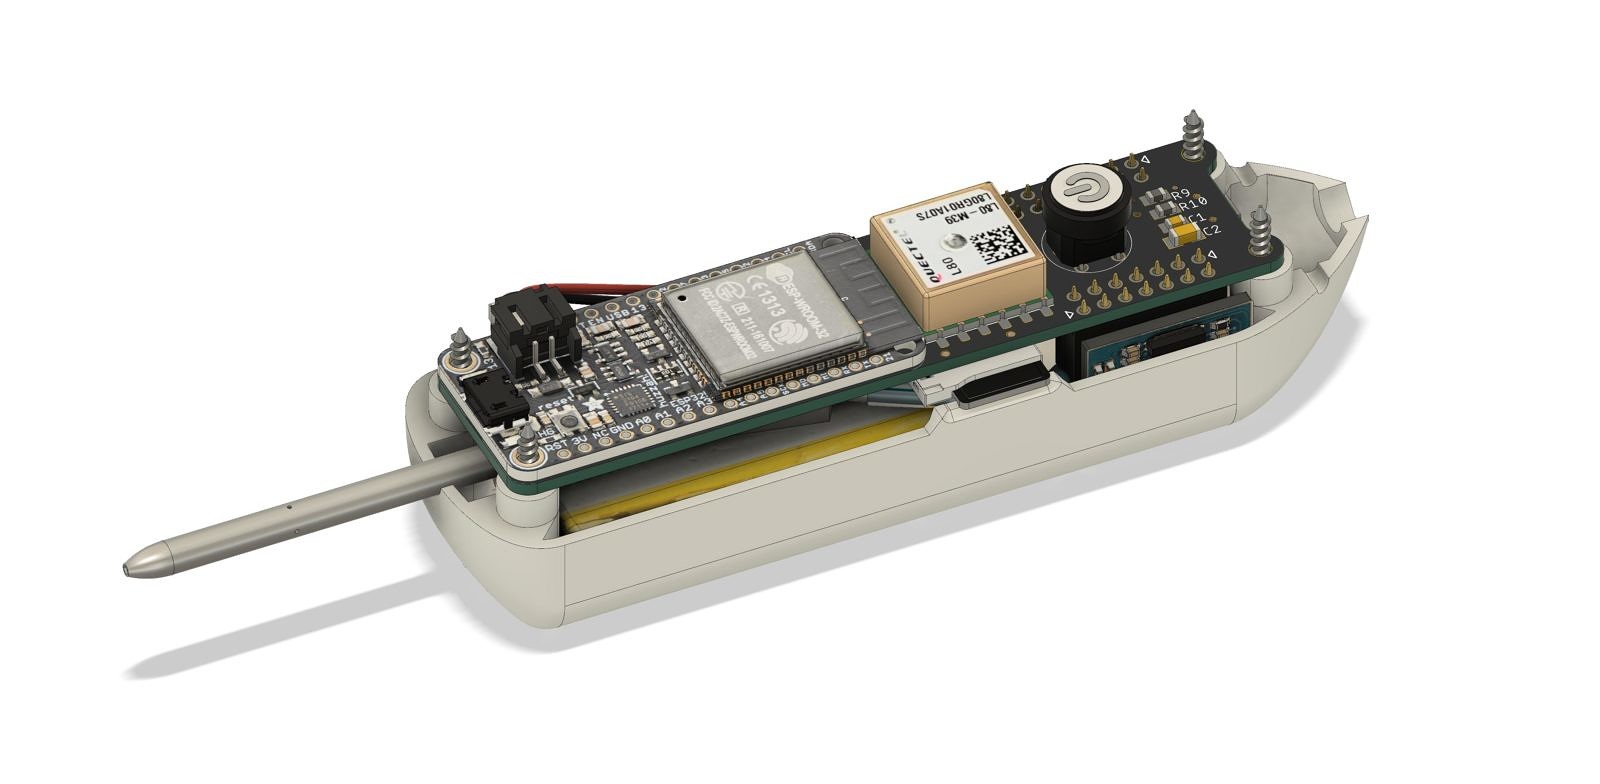
Coming to the final prototype, which was used in flight tests, I have excluded all unnecessary features, and soldered sensor boards directly to main PCB.

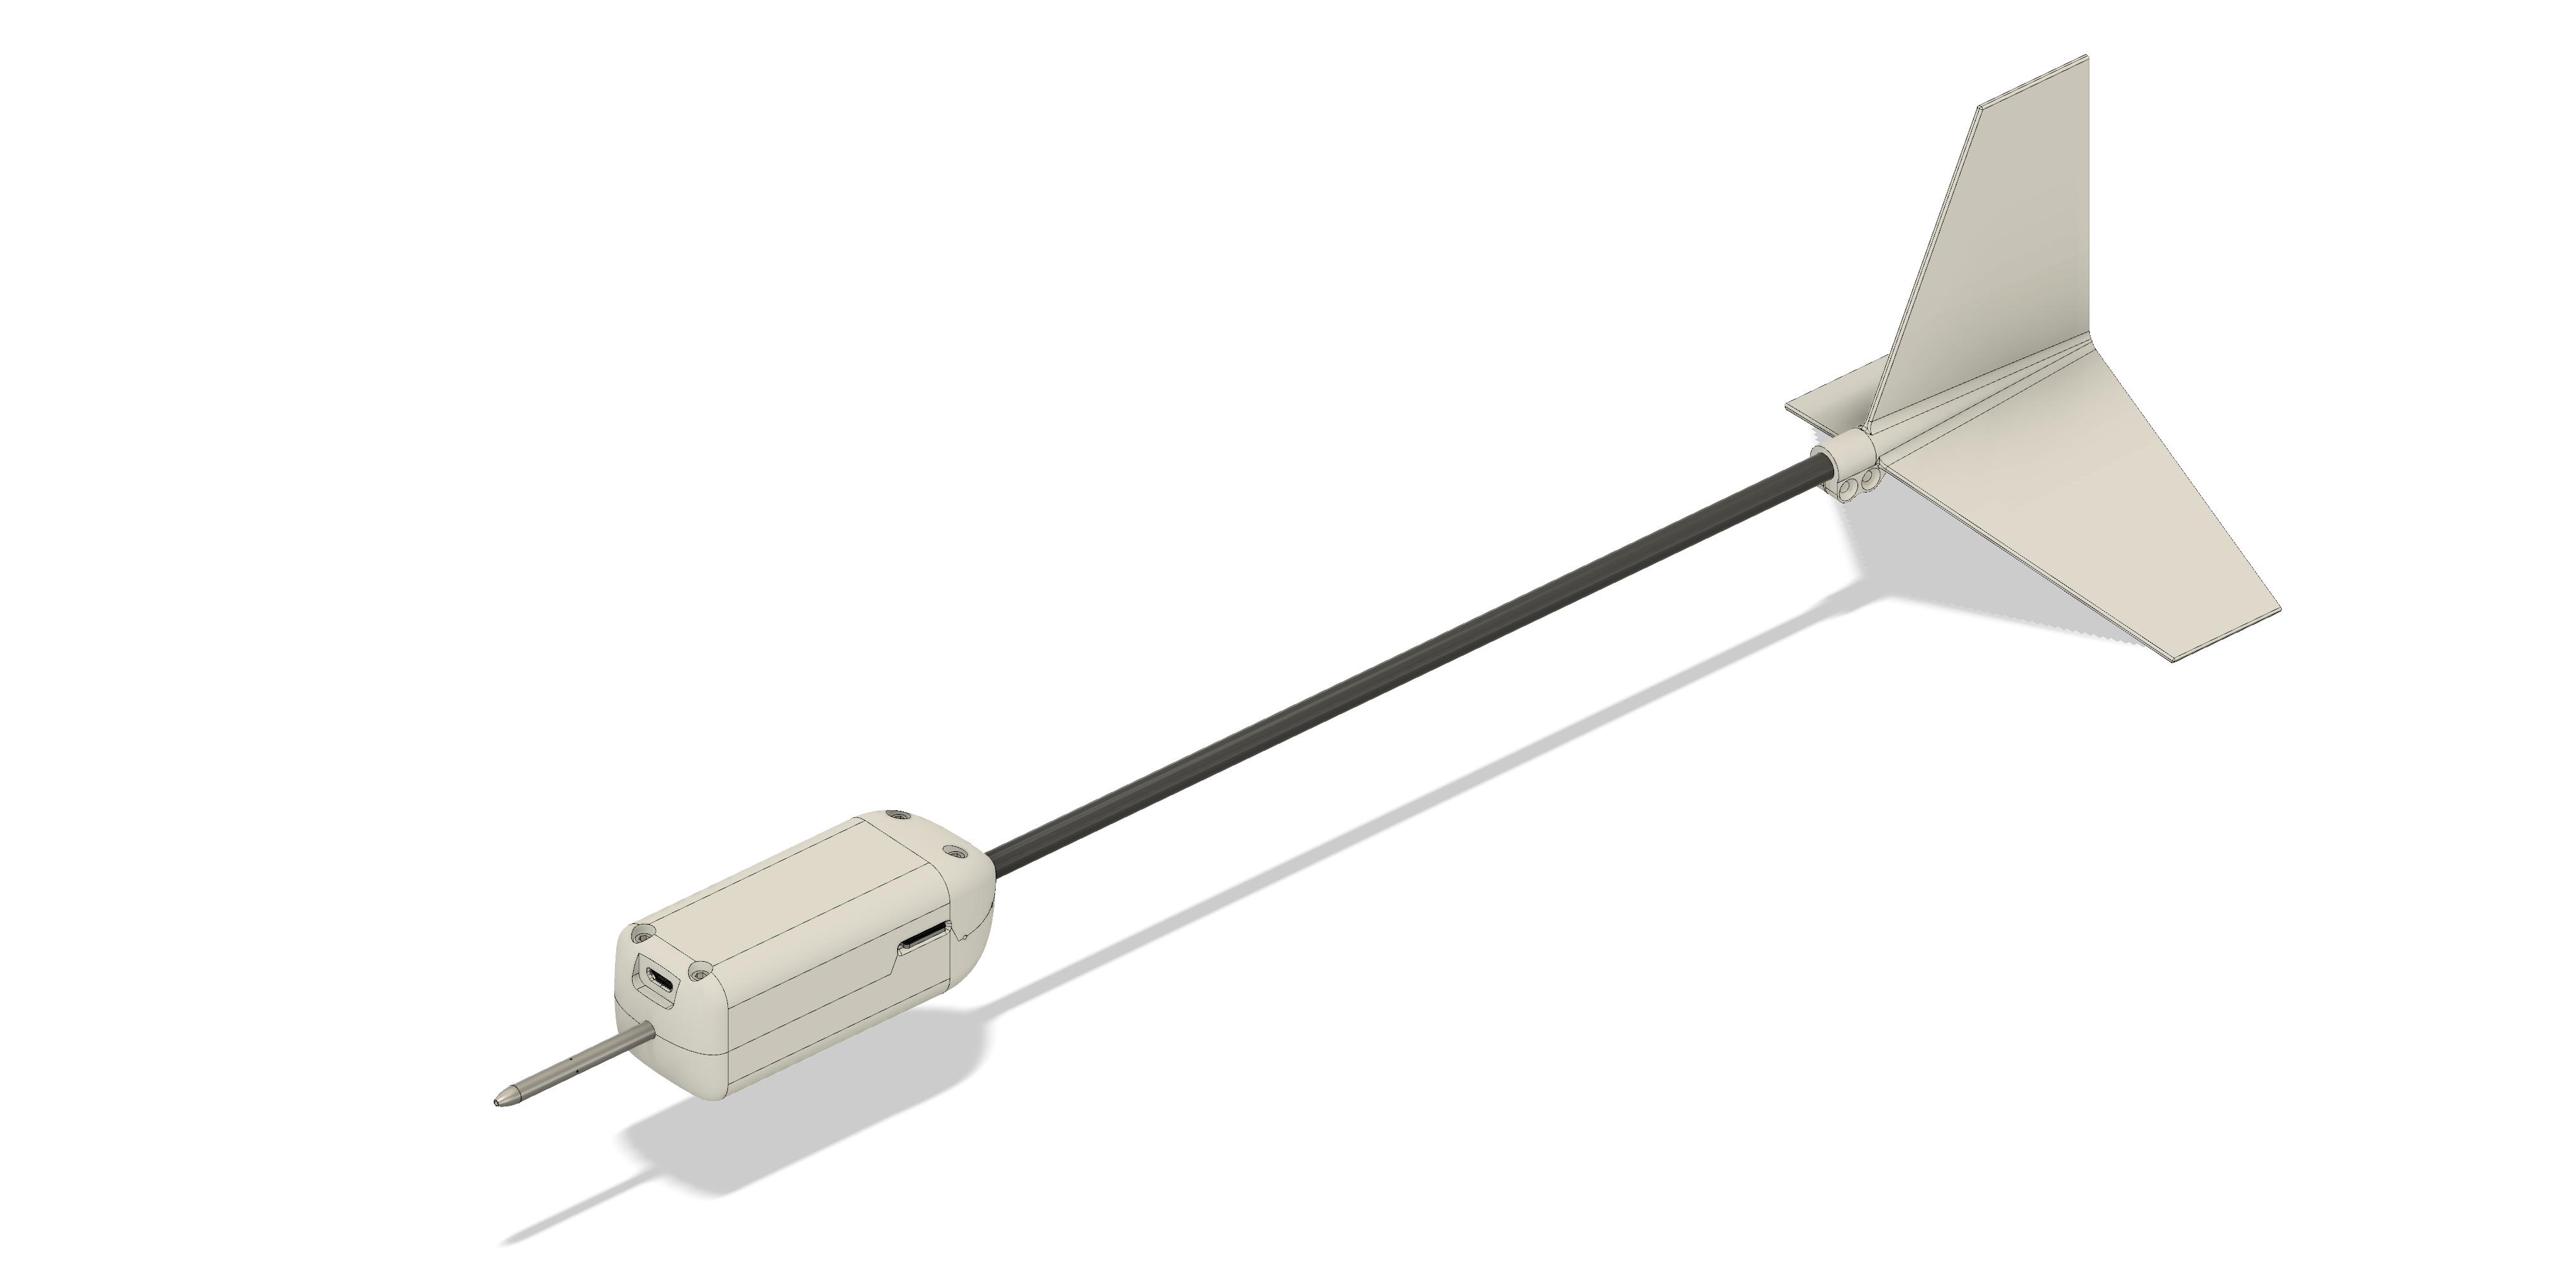
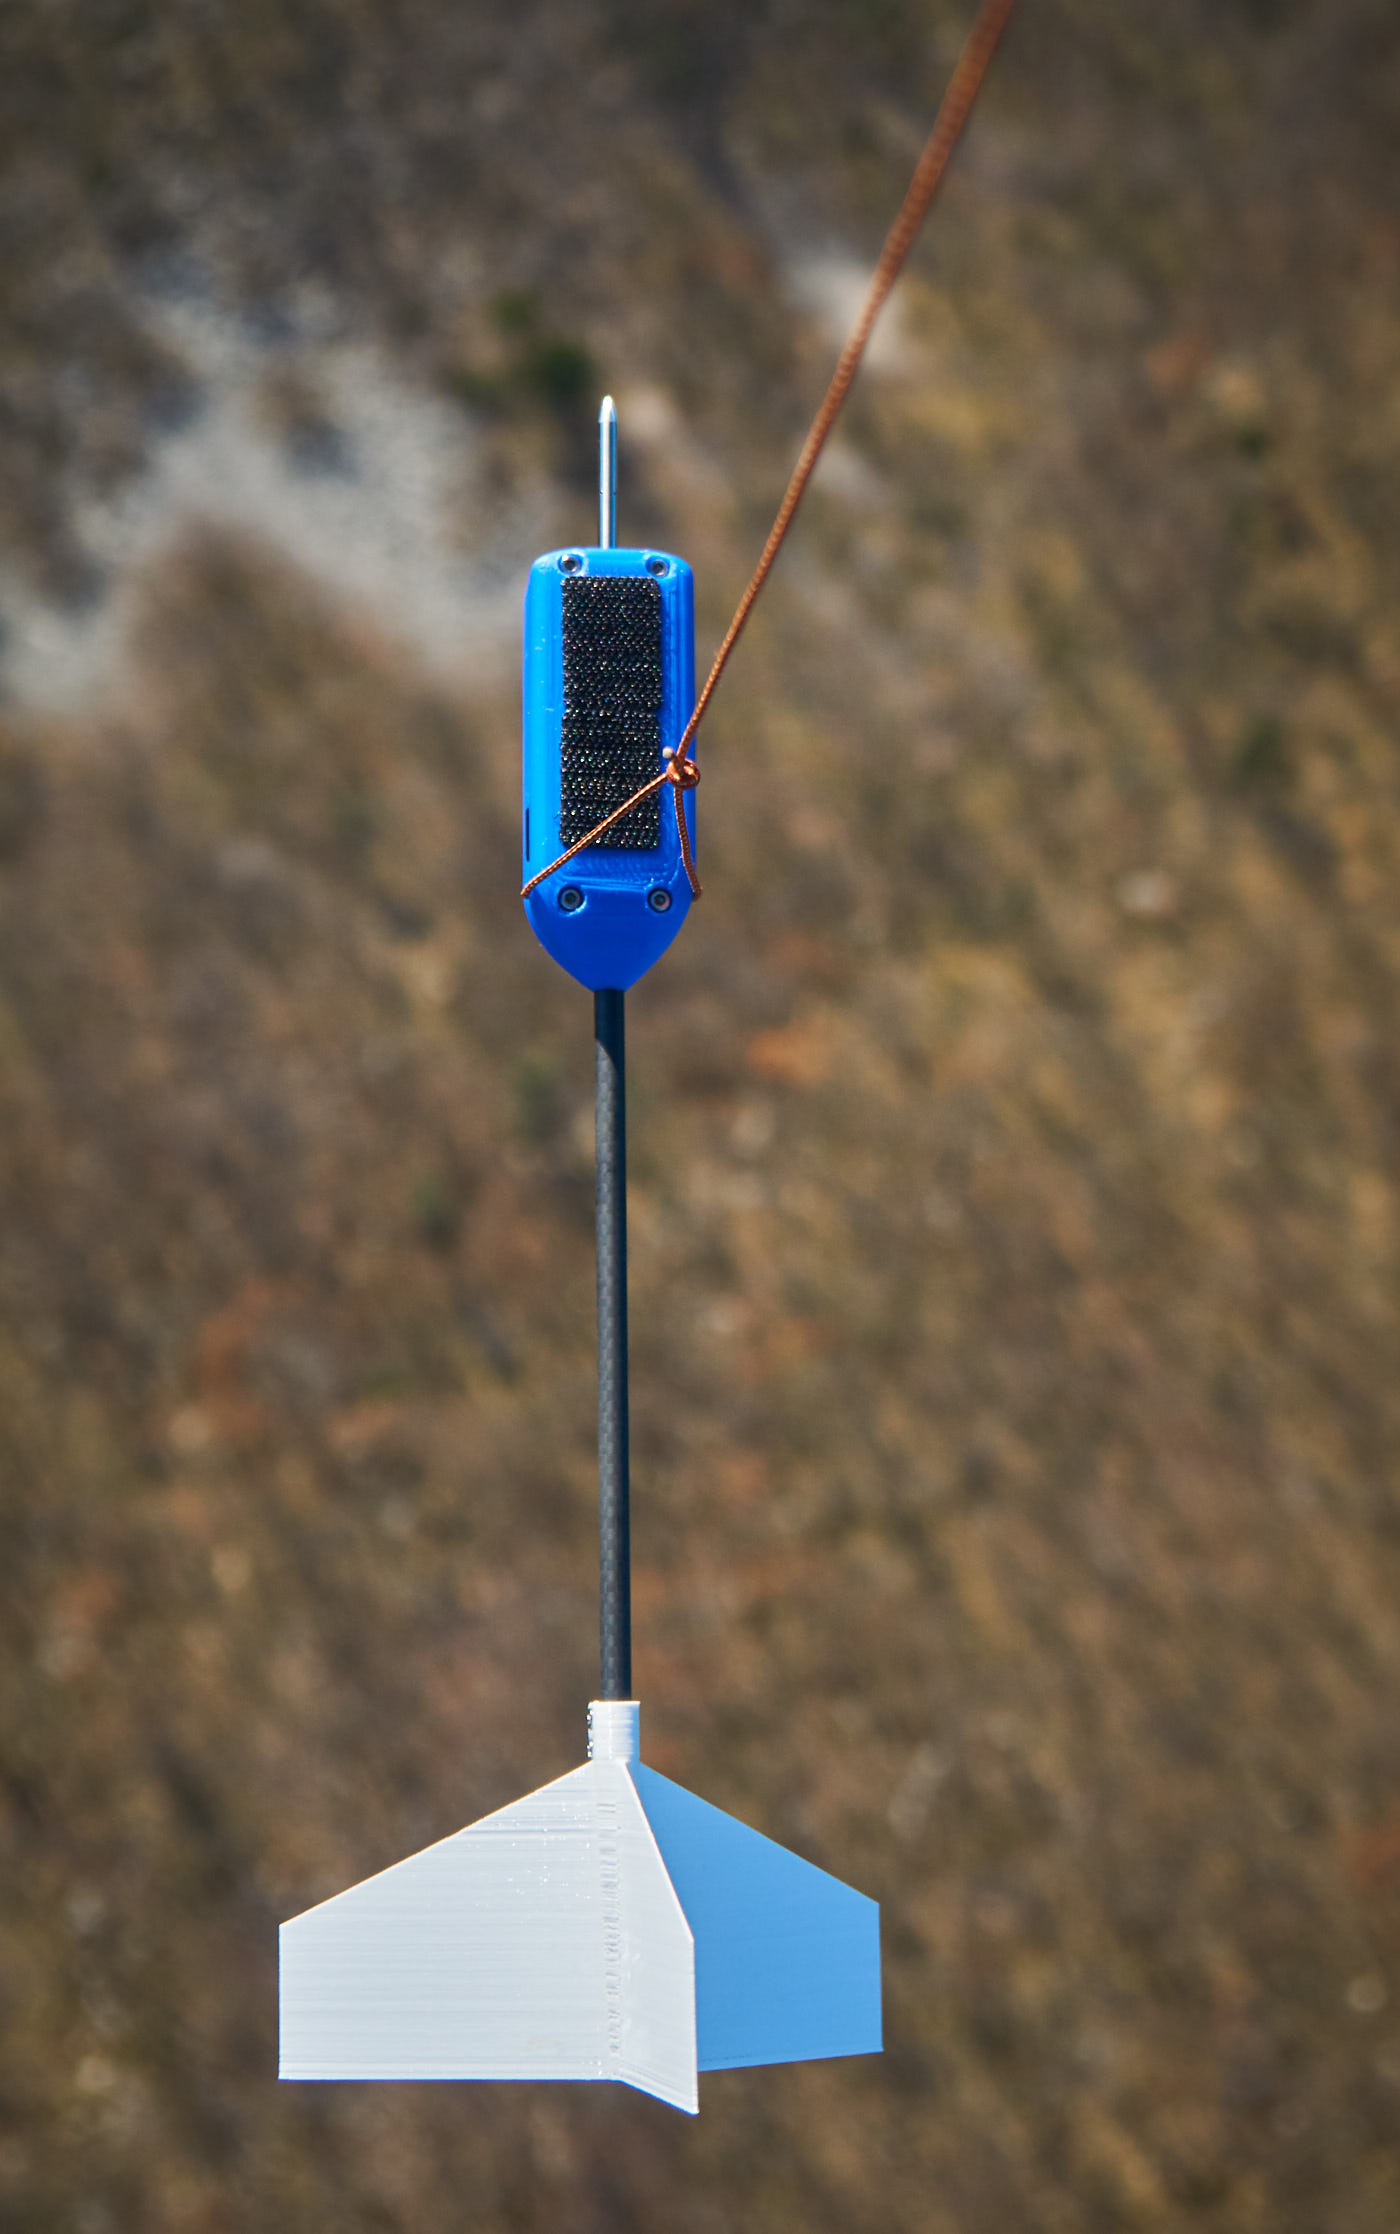
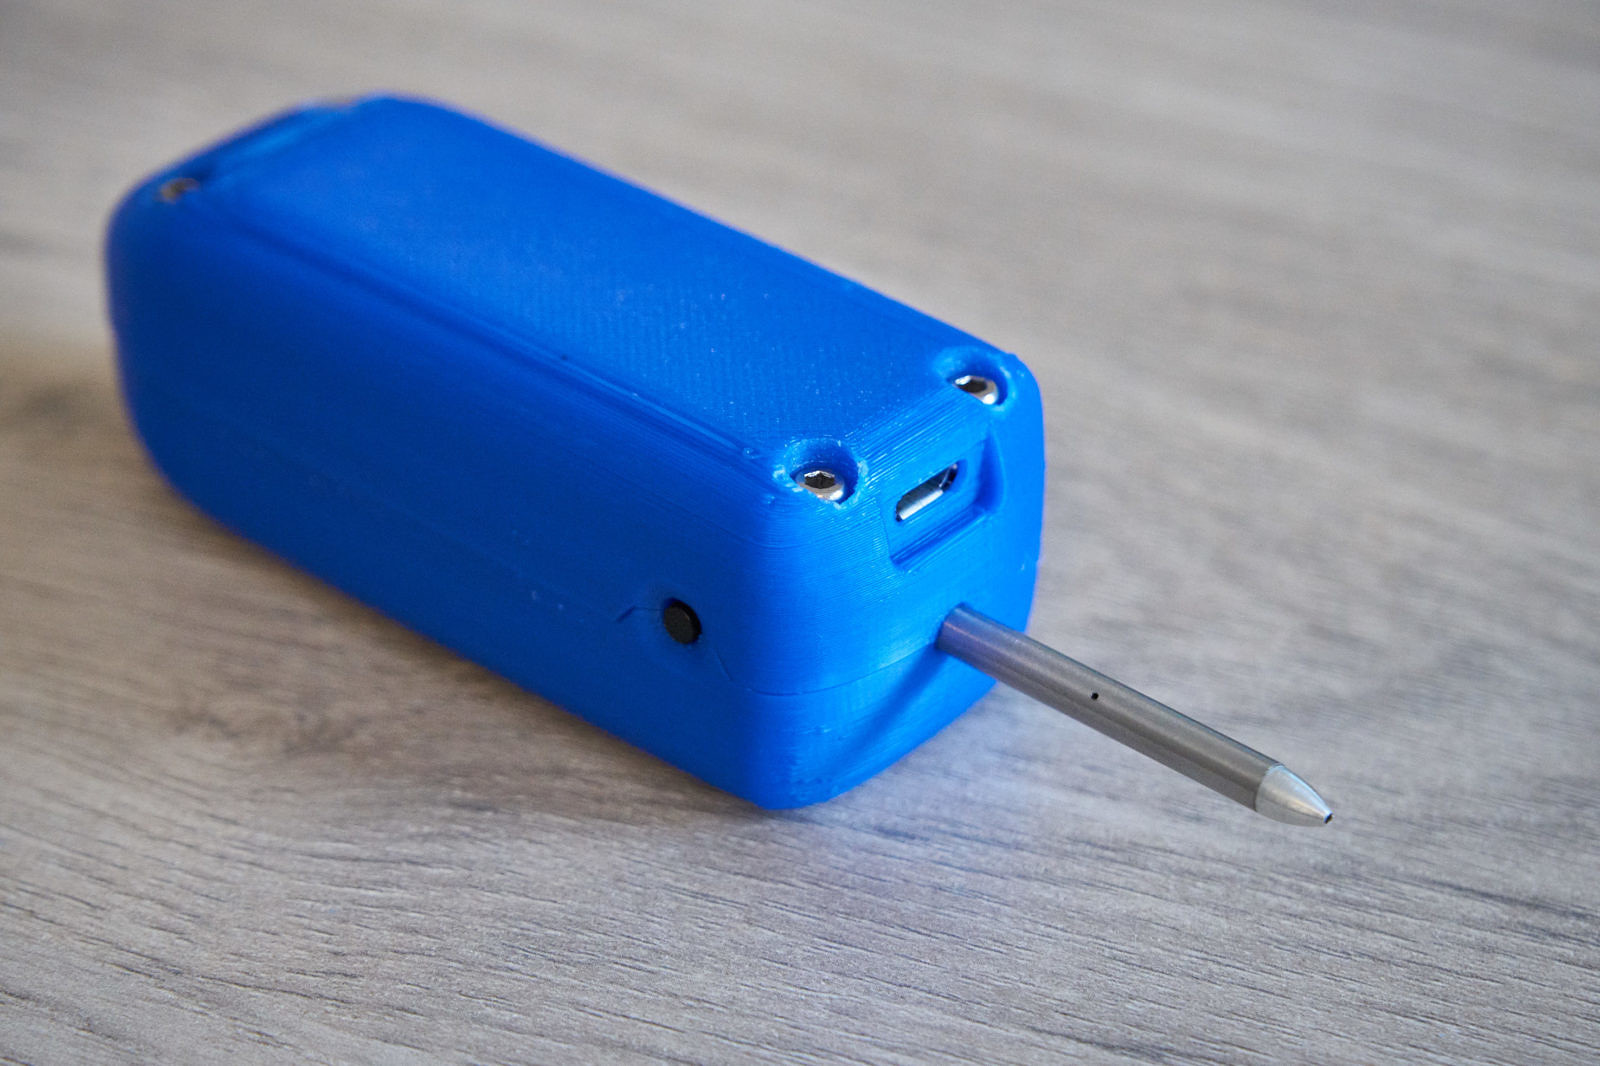
* Later the tail was rebuilt. It has become 1.5 times longer. Modification improved angular stability.
I have built the firmware with the aid of Arduino libraries. They saved me much time, because I didn’t have to deal with hundreds of orientation sensor registers, with file system on SD card, with BLE-stack and so on.
Dataflow of measurements from sensors is captured 10 times per second and written to a file on SD card.
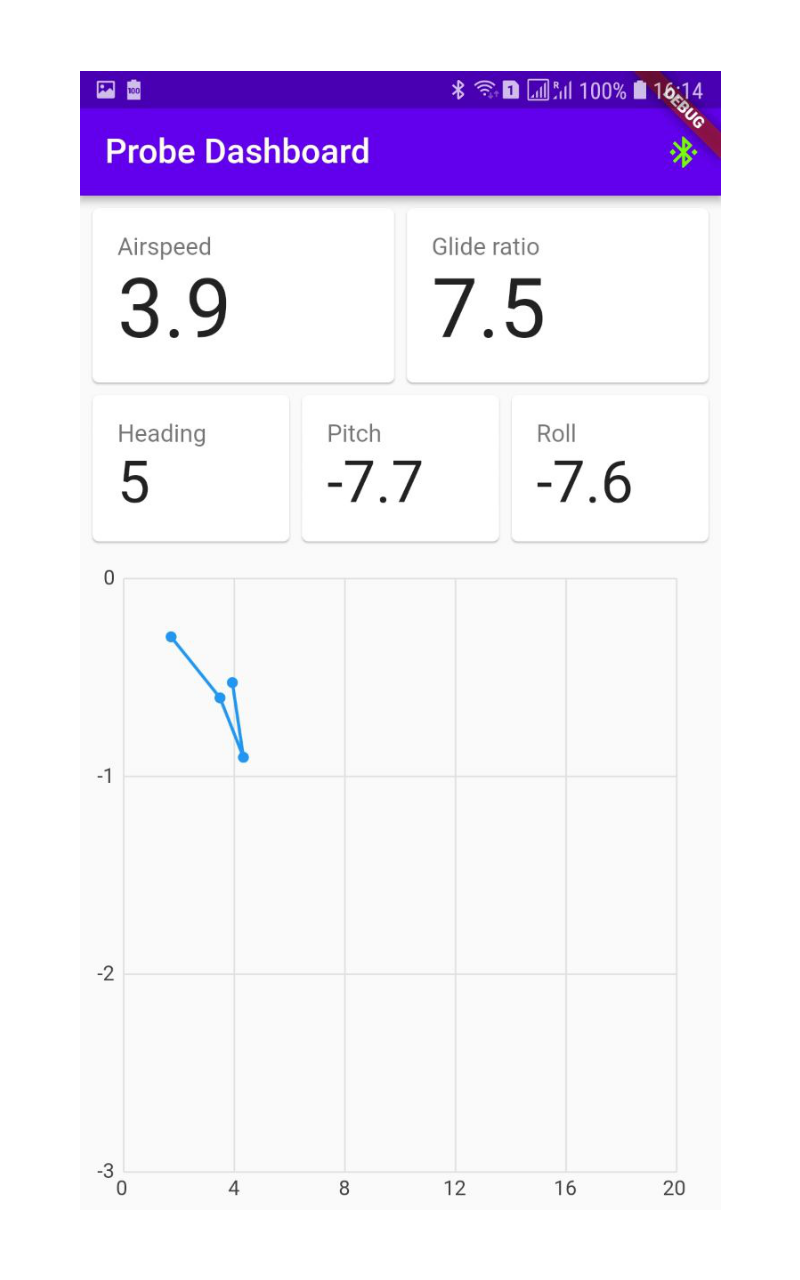
I created a simple app for a phone, where I can check basic parameters directly in flight. Phone connects to the device via Bluetooth. Graph shows horizontal and vertical components of airspeed. They are calculated from total airspeed value and glide angle. Graph shows a «tail» of data for the last second. The phone app exists only for convenience, because the device records data autonomously.
The first flights showed that my idea worked well. Horizon plane orientation was determined surprisingly well. It turned out that oscillations of the device below pilot and oscillations of the wing in general significantly exceed precision of measurements. On one hand, it was good. It meant that I didn’t reach technological limit in terms of precision. On the other hand, it meant that I had to cope with those oscillations.
Fun fact: I could not understand for a long time why the device showed «wrong» pitch values during thermal climb. Pitch was definitely positive, which is impossible. First suspicion fell on orientation sensor. I supposed that sensor could loose its calibration during constant non-zero acceleration during climbing. Later I understood that source of pitch deviation was in the fact that thermal is non-uniform. Wing is located closer to the core. The pilot is located on the periphery and in some cases can literally move upwards relative to the surrounding air, since he is connected to the wing with lines of constant length. So, if you feel that you fly up relative to air a strong narrow thermal, then most likely it indeed happens with you.
It turned to be a difficult task to compute a polar curve from the recorded track.
At first, I had to create some software that would show collected measurements graphically. Without filtration all measured parameters fluctuate quite strongly, even when flying in calm air. How strong? Pitch fluctuates in range of couple degrees. It’s unnoticeable by the pilot, but without filtering polar curve turns into a shapeless cloud of points. However, even a simple averaging over several seconds solves the issue.
One more note on oscillations. Wing oscillates at least 10-15 seconds after finishing any maneuvers, with oscillation period of around 7 seconds. In order to do measurements in every mode you have to set speed with speed system or brakes, wait 15 useless seconds and only then you can start measuring. Measurements duration should be at least 1 minute for every speed mode. You can’t turn or even move in your harness. If you take into account all maneuvers and waiting, you will spend around 1 km of altitude while testing all flight modes.
Here are several screenshots of analytics software I developed. These measurements correspond to the polar curve in the beginning of the article. 5 clouds of points match the following modes: low-speed flight (brakes at carabiners level), trim speed and 3 steps of speed system. Green bar at the bottom denotes track points, which were automatically selected by a set of criteria. These points are included in polar curve calculation.
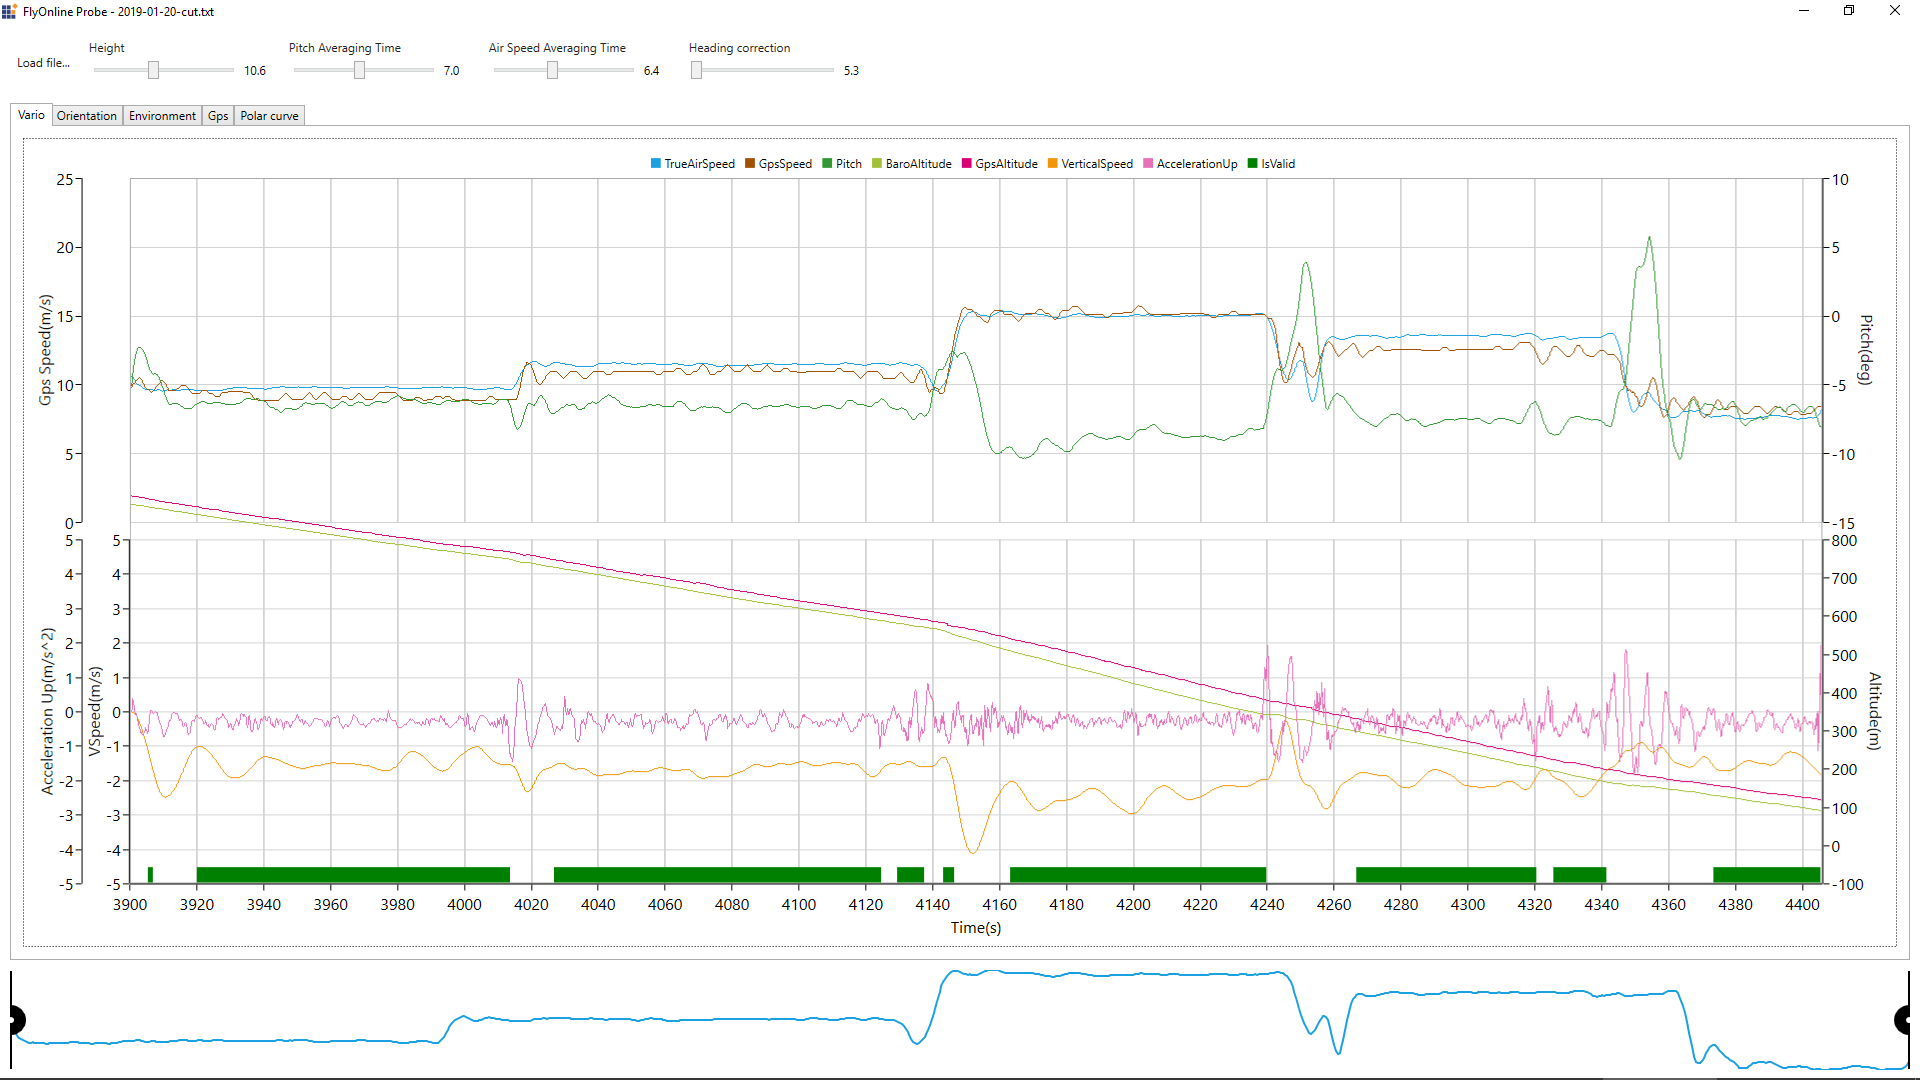
An additional explanation on airspeeds. By the aid of Pitot tube and differential pressure sensor you can measure and calculate indicated airspeed (IAS). You can calculate corresponding true airspeed (TAS) using a formula and measurements of absolute pressure and temperature. At 1km altitude the difference is around 2 km/h, and it increases with increasing altitude. It is sensible to talk about polar curve of a paraglider in terms of indicated airspeed, but not of true airspeed, which you can measure as high as you wish by doing measurements at high altitude.
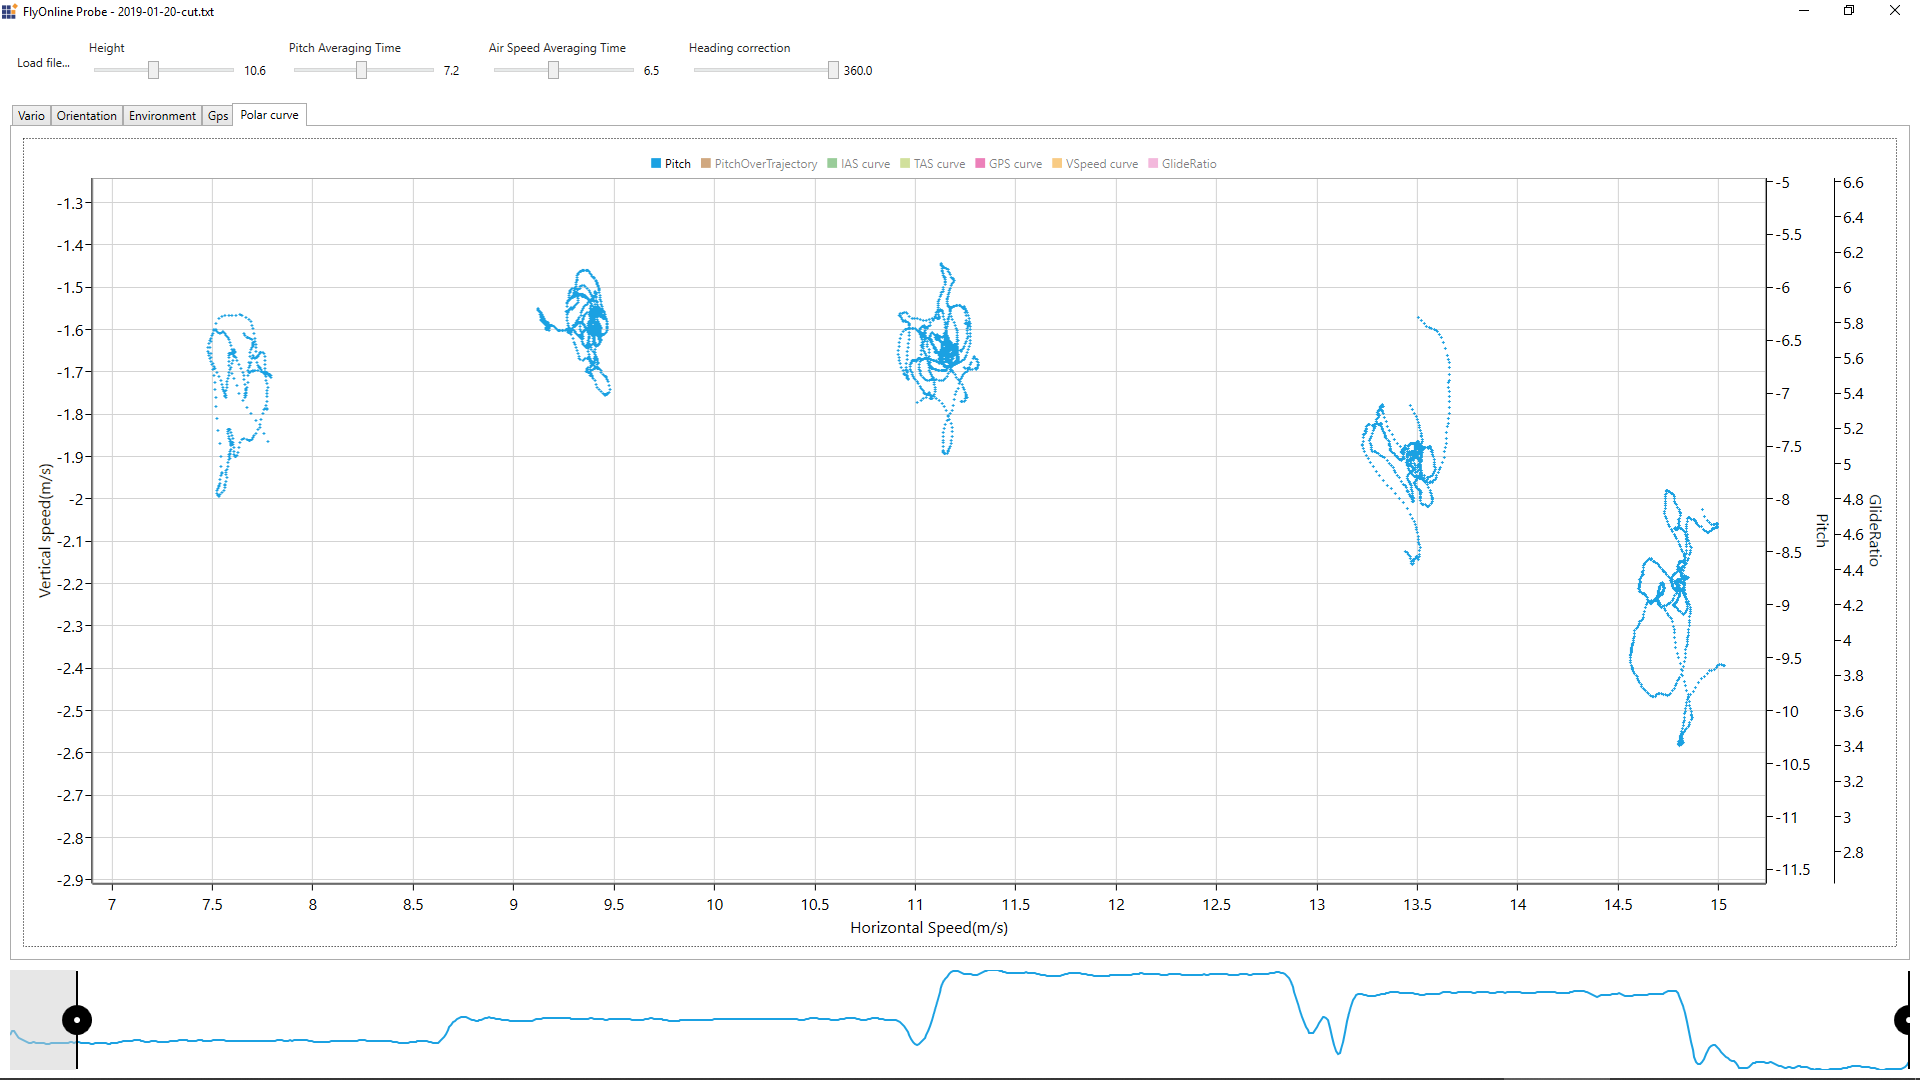
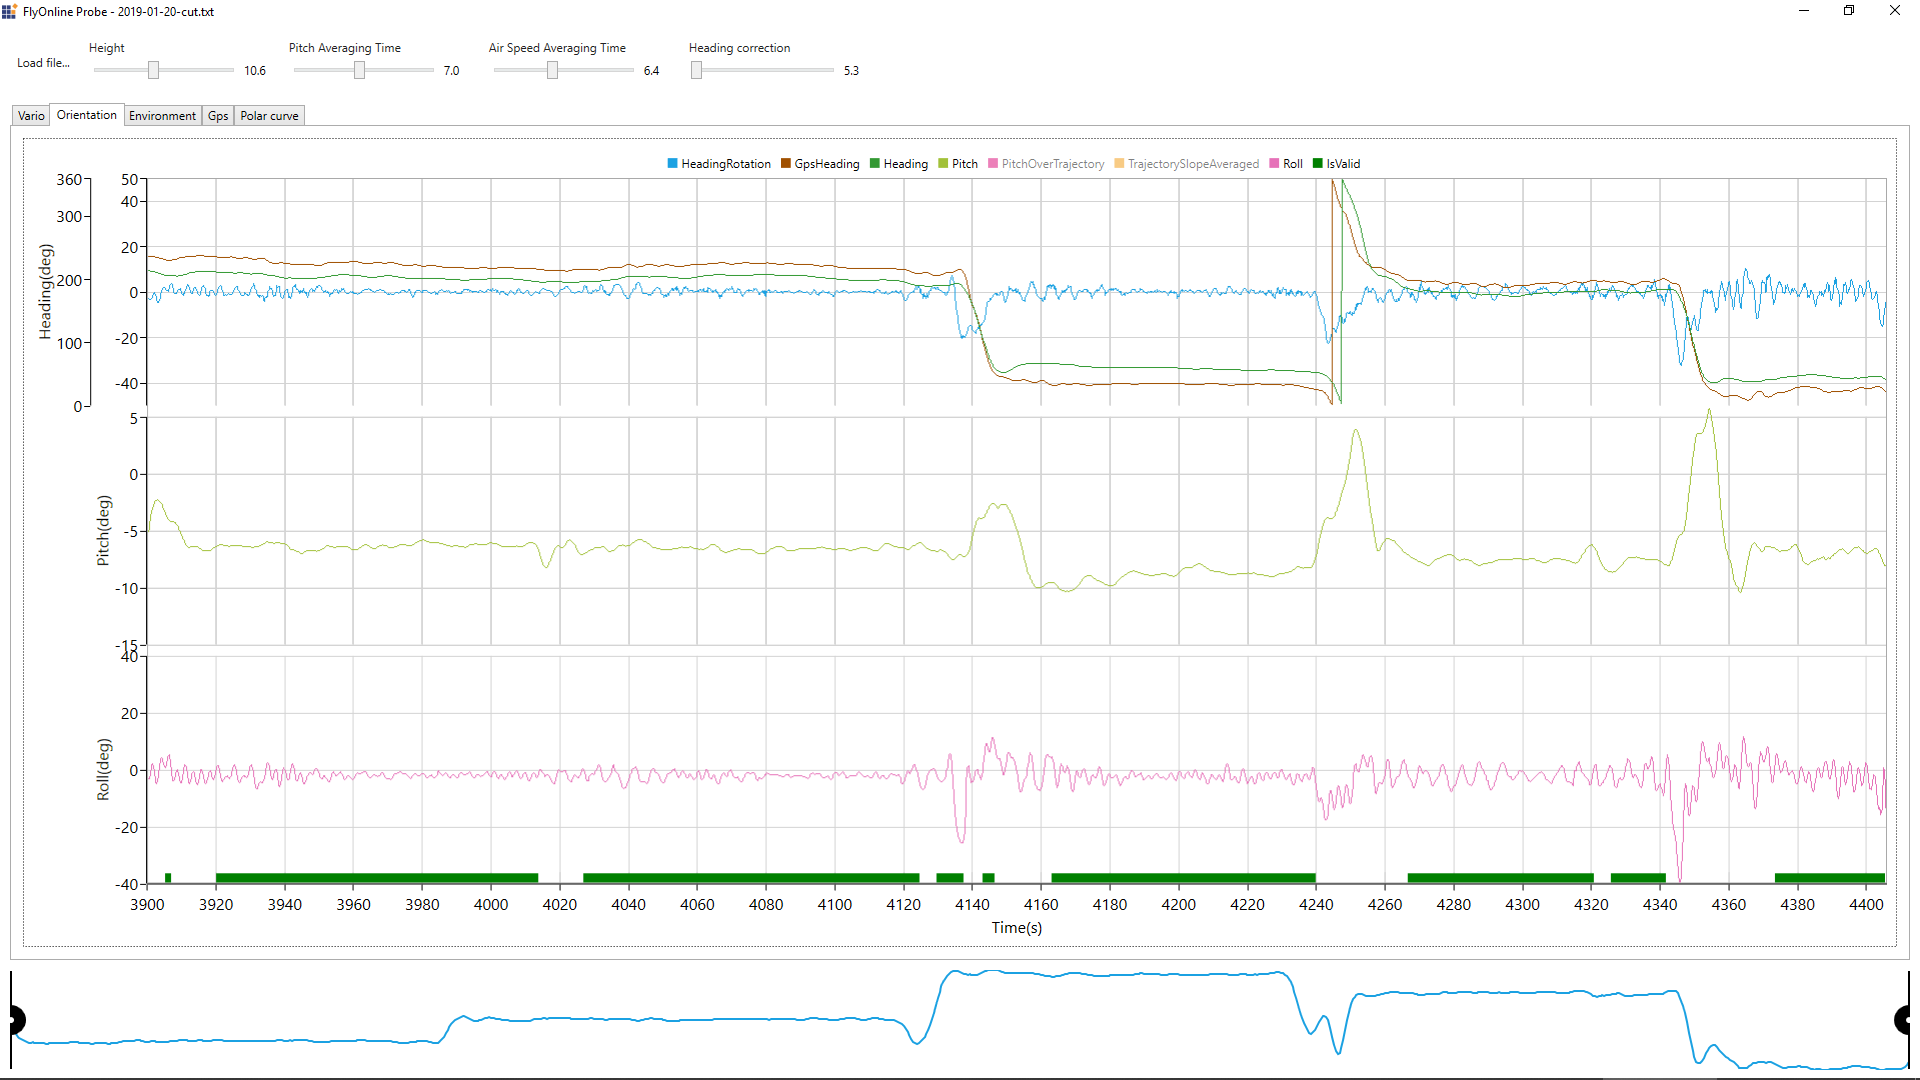
If you look at pitch graph you will see that the whole range of glide ratio (from bad to excellent) fits into the range of angles from -9 to -6 degrees. Difference in modes of 0.5 degree and even less are clearly visible. Unusual cloud points corresponding to maximum speed can be explained with the fact that it is difficult to fly on full speed bar for a long period of time without any, even small, movements. «Tails» on this and other graphics are due to imperfection of algorithm for selecting points for glide ratio calculation. Later they will disappear, I hope.
Let’s look at polar curve zoomed in near to trim speed.
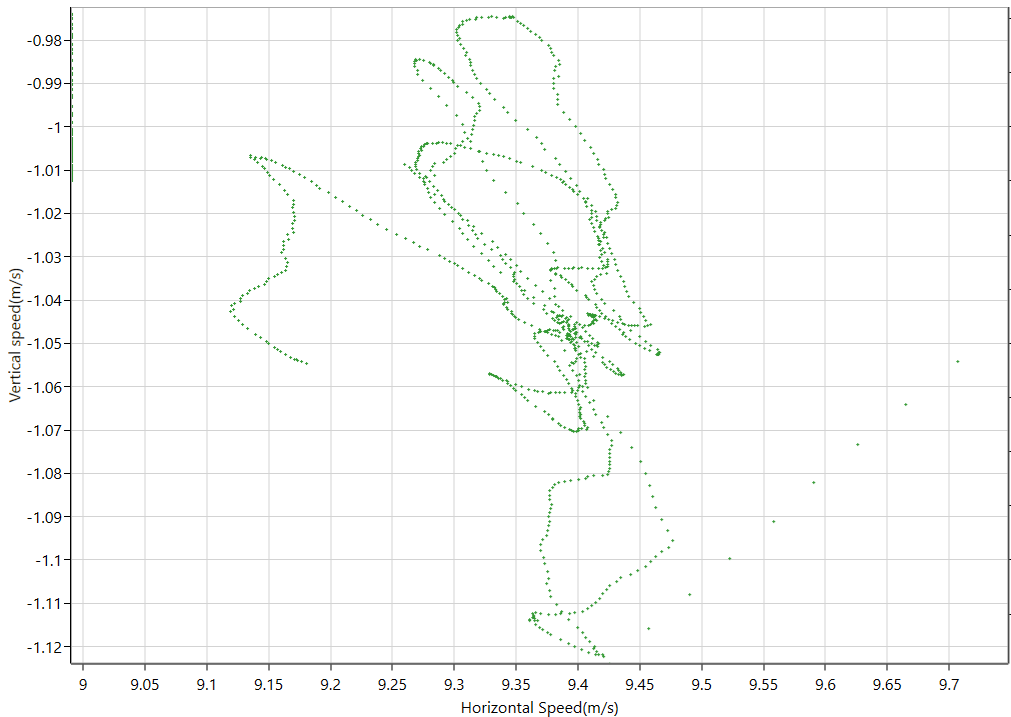
It’s clear that there is a region of stable measurements. And there is a number of «tails», corresponding to transition modes. It turned out to be a difficult task to create an algorithm that would select only correct points and will throw away all «bad» transition points. I work on this task now.
Orientation sensor calculates an angle between its own «horizontal» plane and Earth horizon. It would be a great surprise if these planes matched in case of horizontal airflow. I solved the problem in the following way.
I selected a straight horizontal road and weather conditions with no wind. I drove a car there and back several times holding a stick out of the window with the device attached. I expected average pitch to give me exactly the calibration angle. I was surprised to see 2 clouds of points on pitch graph. Those 2 clouds merged into a single one after I took altitude profile of the road into account. 50 meters of altitude difference on 5 km road gave me 0.57 degrees average pitch, which is pretty much relative to 0.1-degree precision of horizontal plane calculation. Calibration adjusted pitch by 1.5 degrees.
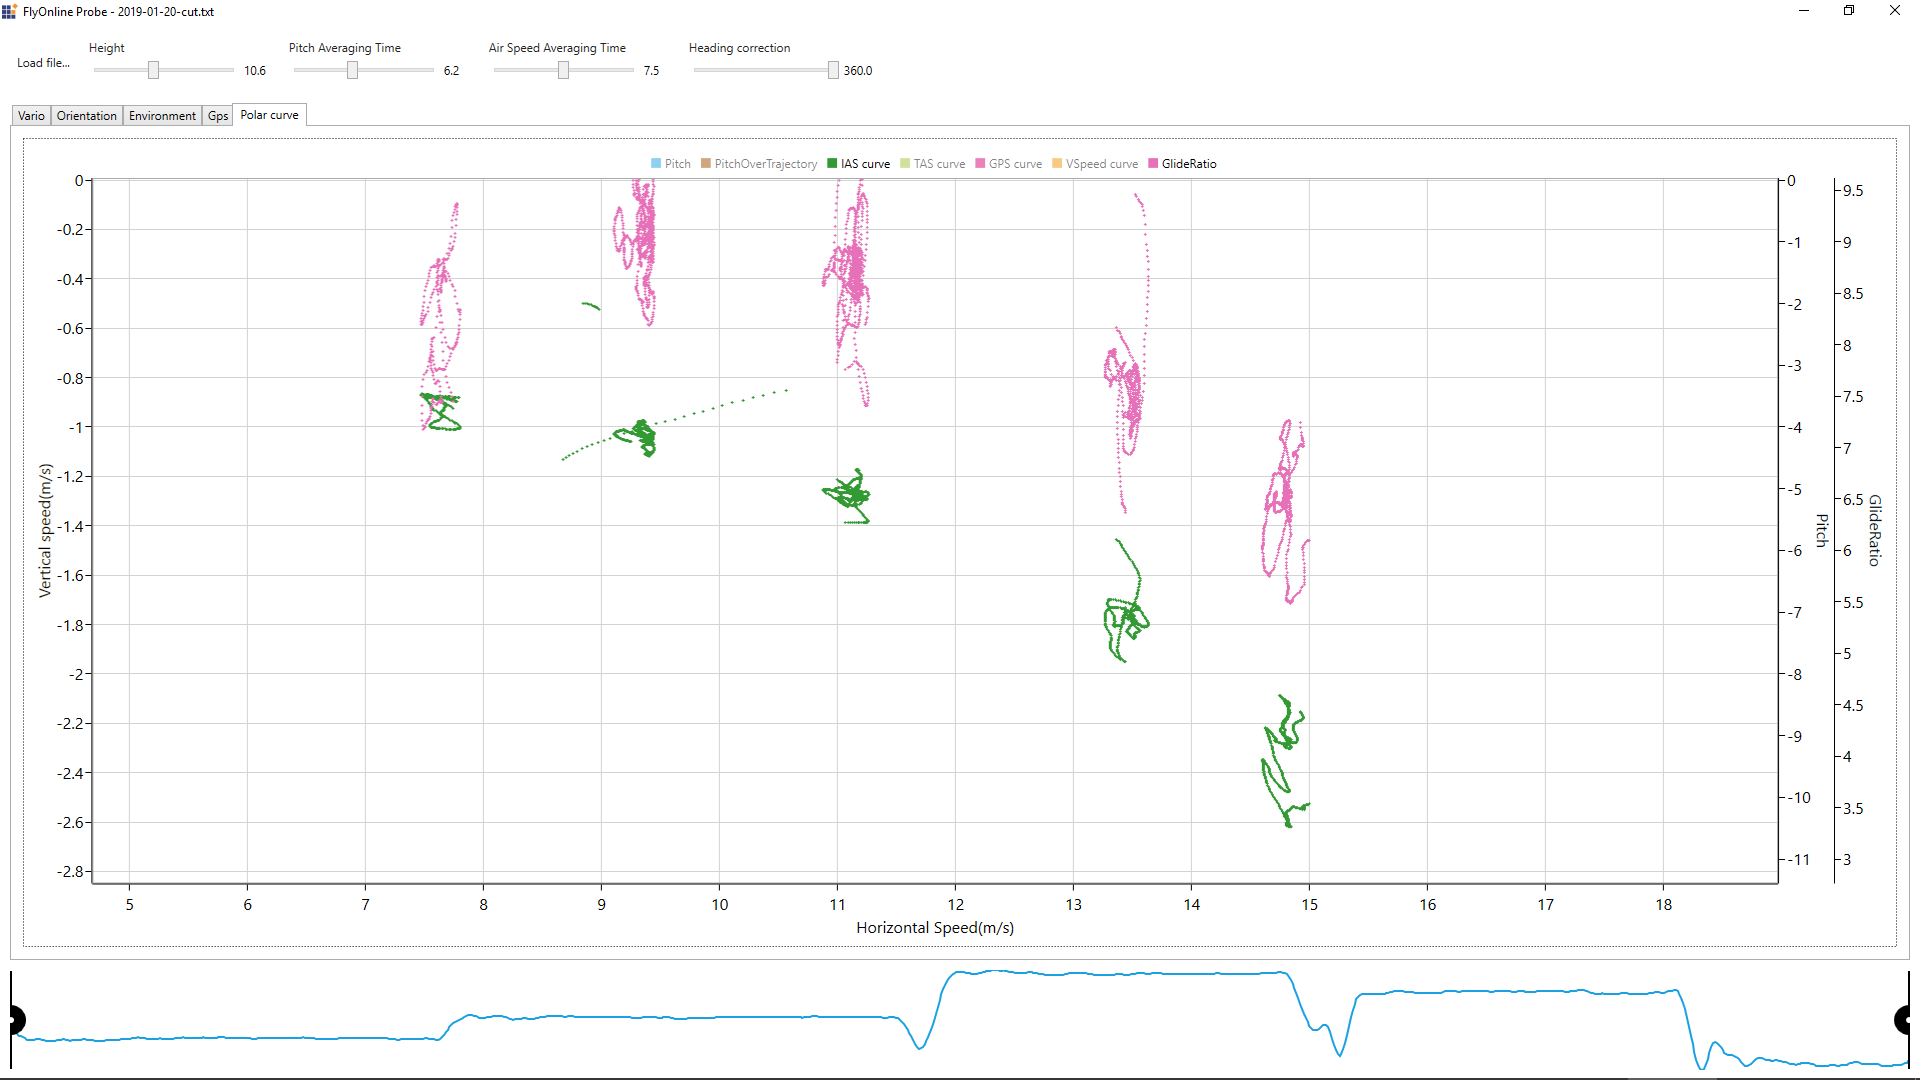
Classic polar curve (green points on chart above) is not enough informative. Polar curve tends to line up along a straight line. And difference in glide ratio are not evident. In some cases, it is more convenient to use graph of glide ratio vs. airspeed (rose points, scale to the right). It’s evident that maximum glide speed matches exactly trim speed. And that glide ratio at full speed bar gets much worse. It’s interesting that applying brakes does not increase sink speed, so making low-speed maneuvers still makes sense with my wing.
Interesting fact: higher is the glide ratio, higher are requirements to accuracy in measuring angles. Glide ratio of 5-7 points is relatively easy to measure. But we would have huge problems with 15+ glide ratio wings.
A few words about the wing tested. Niviuk Peak 3 21. En D, 2.5-liner, 2013 year model. Its total airtime is more than 200 hours, though lines are new (less than 20 hours). Weight range is 70-85, 85 kg load.
The first idea that comes after looking at the polar curve calculated sounds like this: Why should we measure angle? What if we use airspeed for horizontal movement and vertical speed (relative to earth) for vertical movement?
I record all the measurements so this idea is easy to check.
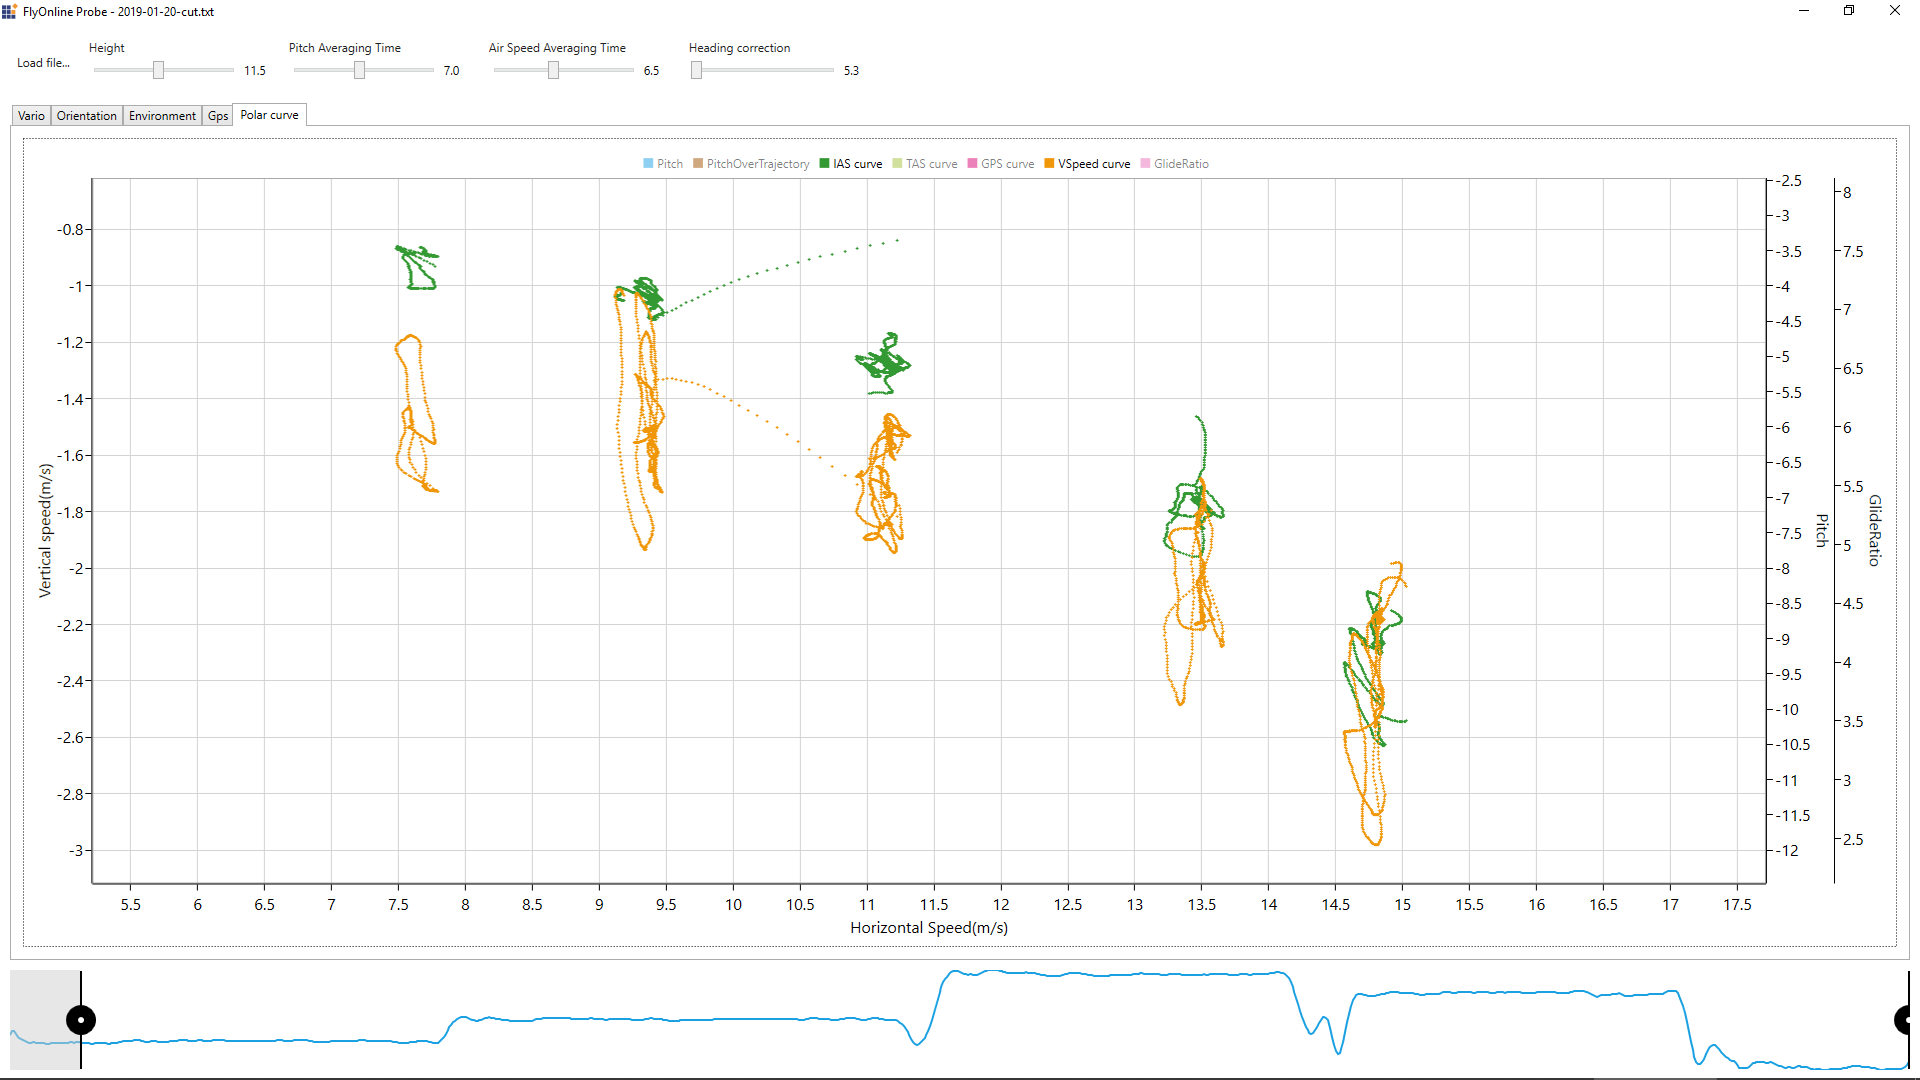
Vertical speed relative to ground is indicated with yellow color on the chart above. As you can see deviation of points is much more than deviation in angle calculations. And some point clouds are even shifted down. By the way, measurements were held in stable winter air almost without thermal activity.
Next big task is to develop algorithms of smart and non-destroying filtering of data recorded.